Editor’s Note – The Heritage Foundation produced a report on federal spending and what it means to you. In the following post, several key points were listed and analyzed by the Daily Signal.
However, the lengthy report has 22 charts to plainly show the true picture, without political talking points. We hope you read the summary below and then take a moment to see the whole report. Here are the titles of the charts (3 are listed in the article):
- The Federal Budget, 1994 – 2014;
- Entitlements and Interest on the Debt Account for 85% of Spending Growth Through 2024;
- Where does all the money go;
- Where did every dollar in spending go;
- Mandatory spending more than doubled as a share of the economy;
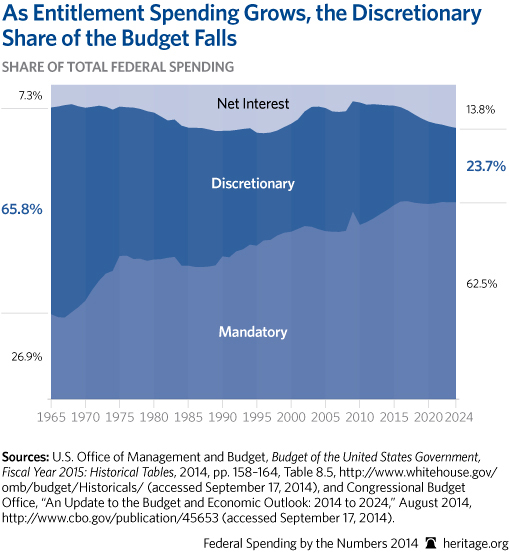
- As entitlement spending grows, the discretionary part of the budget falls;
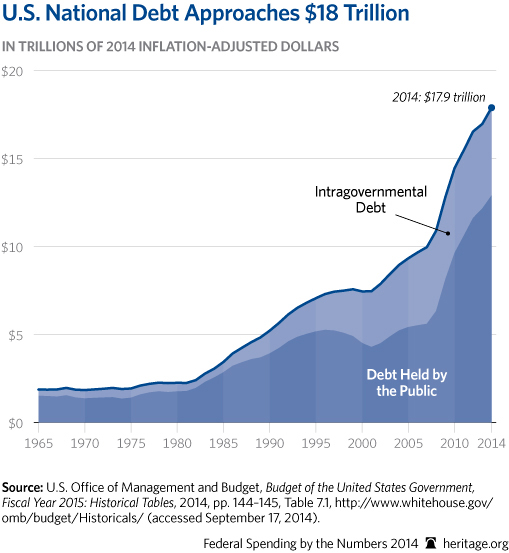
- US National Debt Surpasses $18 Trillion;
- Debit borrowed in credit markets at 50 year high;
- Deficits return to trillion dollar level by 2021;
- Net interest cost will double in five years, nearly triple in eight;
- Medicaid is the fastest growing major entitlement;
- What is driving the growth in entitlement spending;
- Obamacare increases federal health care spending;
- Obamacare’s annual spending exceeds $200 Billion by 2012;
- Food Stamps is one of the largest welfare programs;
- Total welfare spending reaches $949 Billion;
- Federal spending per household is on the rise;
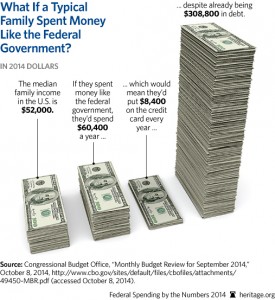
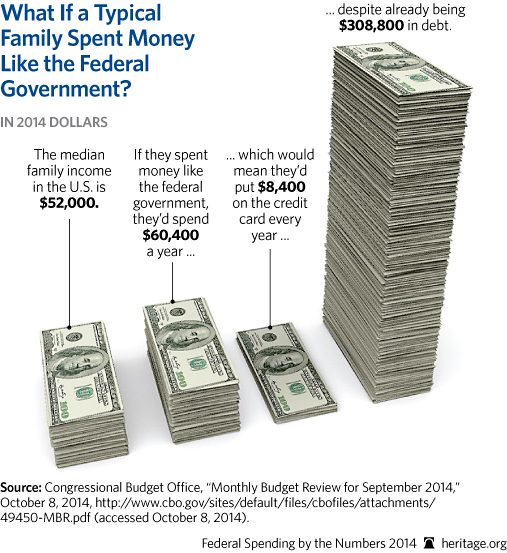
- What if a typical family spent like the federal government; (One of our favorites on right, click for larger image)
- Budget Control Act reduces discretionary spending to pre-‘stimulus’ levels;
- Budget Control Act reduces discretionary spending after ‘stimulus’ ends, but only temporarily;
- House Budget saves taxpayers $6 Trillion compared with President Obama’s Budget;
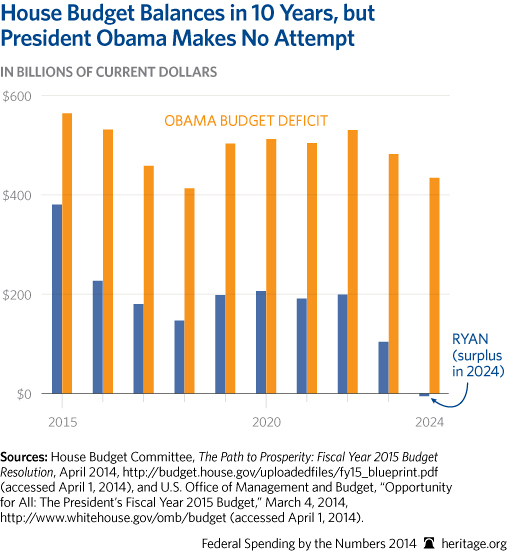
- House Budget balances in 10 years, President Obama makes no attempt;
The report also lists 51 examples of other egregious spending you will want to see. (The article points out a couple below in the article.)
It sites three categories, each with numerous examples. They are: Mismanagement, Corporate Welfare, and Questionable Federal Research. Happy reading, please read the whole report!
Average Federal Spending Per Household Nearly $30K
By Spencer Woody – Daily Signal
Did you know that the National Institutes of Health spent $374,000 to find out if a puppet show would convince preschoolers to eat more vegetables? Or that the Department of Agriculture gave $50,000 to a business that packs and sells alpaca manure?
Your tax dollars paid for it–and much more. In 2014, federal spending per household was $28,826.
Here are some more key facts from “Federal Spending by the Numbers 2014,” a new Heritage report.
1.) Even with the temporary drop in deficits and the Budget Control Act, federal spending and the national debt are projected to increase drastically.
The current national debt tops $18 trillion, which is more than 100 percent of the national Gross Domestic Product. Without reforming federal spending, especially on Medicare, Medicaid and Social Security, the rising debt threatens Americans with higher taxes and fewer economic opportunities through less growth. At some point, investors may even lose confidence in the federal government’s ability to service the debt.
2.) Federal Spending drives the debt, specifically entitlement spending on Medicare, Medicaid and Social Security and on means-tested welfare.
Entitlement programs are considered mandatory spending, meaning they are set to grow on auto-pilot, unchecked by Congress each year. As spending on entitlement and welfare programs squeezes funding for national priorities, it raises concerns that Congress is not adequately funding America’s national defense because entitlements get the first call on federal revenues.
3.) Putting the budget on a path to balance is not an easy task politically, but reining in federal spending is a must to enable economic opportunity and growth for younger and future generations.
As government spending and debt grows, it crowds out private investment, which translates to fewer jobs and lower wages for Americans. President Obama fails to realize this: Under his budget plan, both spending and the debt are projected to increase, despite a trillion-dollar tax increase. On the other hand, the House’s budget plan created by Rep. Paul Ryan, R-Wisc., balances after 10 years thanks to health care entitlement and welfare reform and elimination of wasteful and duplicated programs.
There is plenty of wasteful spending to cut from the budget, as demonstrated in the 51 examples of government waste that are part of this year’s report.
Just as growth in federal spending and in the scope of the federal government often resulted from small, incremental increases, reining back the federal government starts with small steps. Congress and its constituents should keep this report and its lessons close at hand when considering the budget and other spending requests.